|
================== Our contribution :
|
Les Saisons du Ciel
THE TRANSIT OF VENUS
and
THE BLACK DROP
EFFECT
ON JUNE 8, 2004
Images from TRACE satellite
# partie 6B #
|
# 1er partie : Le transit de Vénus devant le Soleil le matin du 8 juin 2004 |
# partie 6B #
IMAGING from satellite TRACE WHITE LIGHT
Les images originales de TRACE sont disponibles
sur le site :
" TRACE DATA CENTER "
http://vestige.lmsal.com/TRACE/Data/trace_cat.html
|
TRACE section #6B : By members of Dorval Astronomy Club (CDADFS) Mainly G. St-Onge, L. Morin and G. Guignier - The images (in raw format) used in this section come for the website " TRACE DATA CENTER " at the following URL: http://vestige.lmsal.com/TRACE/Data/trace_cat.html - Some processed images used in this page are from Dr. Jay M. Pasachoff (Williams College, Williamstown, Massachusetts, USA) and Dr. Glenn Schneider (Steward Observatory, University of Arizona, Tucson, Arizona, USA), at http://nicmosis.as.arizona.edu:8000/ECLIPSE_WEB/TRANSIT_04/TRACE/ToV_TRACE.html - Page making, methodology and elaboration of this section by G. St-Onge and L. Morin - Translation and Text revision by : G. Guignier |
|
- Summary of this document |
|
Thank you to the TRACE Team ! (Transition Region and Coronal Explorer)
|
|
- Somes images are compared to processed images available on Dr. Jay M. Pasachoff (Williams College,
Williamstown, Massachusetts, USA) and Dr. Glenn Schneider (Steward Observatory, University of Arizona, Tucson,
Arizona, USA) website. These images have been captured by TRACE (Transition Region and Coronal Explorer), which
is supported by the Committee for Research and Exploration of the National Geographic Society and the NASA. Pictures coming from : http://nicmosis.as.arizona.edu:8000/ECLIPSE_WEB/TRANSIT_04/TRACE/ToV_TRACE.html - From Glenn Schneider, Steward Observatory, University
of Arizona |
|
================== Our contribution :
|
|
- Our objectives: Our objectives consisted in detecting the black drop effect on the WL raw images from TRACE satellite and on the already-processed images, provided the instrument has contributed to this phenomenon. We would expect to find on these images, which have been acquired from above the atmosphere, the same effect as on the pictures we have captured from the ground. The analysis we have made on our own images (please refer to Venus Transit Part 5 , Part 7B , Part 8 and Venus Transit, back to the first part ), has permitted to build a model which describes quite well the construction and the evolution of the black-drop effect. - From this model, we have tried to detect on the TRACE images signs of the black-drop effect. Parameters we have used on these pictures: - Images from the TRACE DATA CENTER are originally in FITS format. They have been converted in JPG format in order to be posted online
on this website. - The colour coding used is the thermal palette of Pises Atlas-PRISM98 software edited by the Société Astronomique de Montpellier (authors : C. Cavadore, B. Gaillard, P. Martinole). - Isophotes and contour plots are also used on some images in order to highlight the black-drop effect on some images. - Our results seem to be of interest and worthy to be part of the present document. These images and the analysis we propose along bring another point of view on this captivating phenomenon of the black-drop effect. Enjoy your visit ! |
|
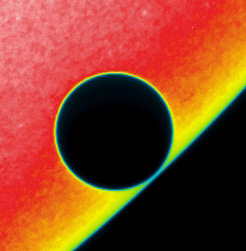
Black-drop progression at the 3rd contact TRACE's WL pass band (White Light) (WL transmission : ~ 200nm à ~900nm) Time is expressed in UT Image #1 - 10h 58 12 - This image does not show any sign of the black drop. Image #1B - 10h 58 12 Using a contour plot rendering, this picture does not show any apparent depression of the sun edge in the region of Venus disk.
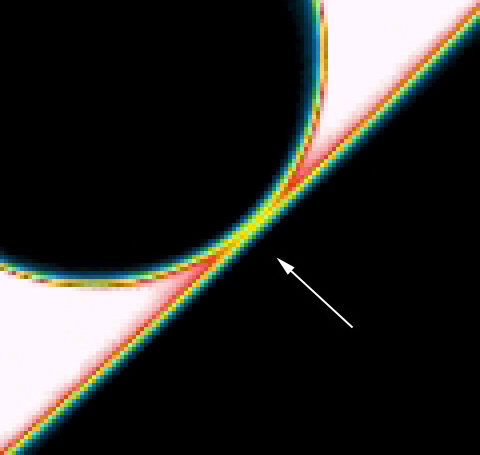
Image 2B The first signs of the black-drop effect!!!
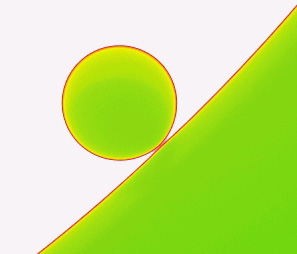
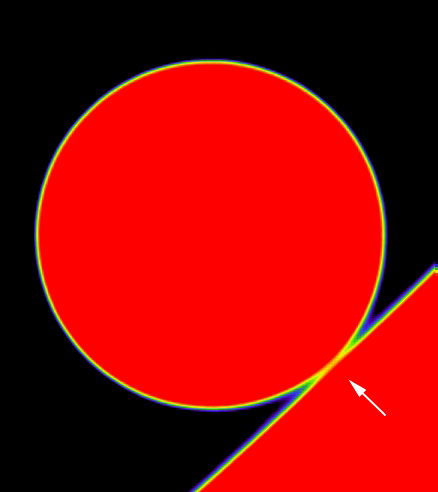
Image #3B - 10h 58 41 On this image (contour plot mode), the apparent depression of the sun edge towards Venus disk can be well observed. Image 3C - 10h 58 41 Magnification of the previous picture.
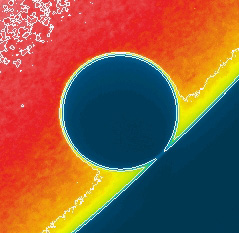
Image #4B - 10h 58 49 The Isophote image shows an apparent bridging cavity at the darker location of the black drop.
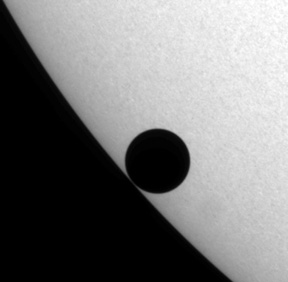
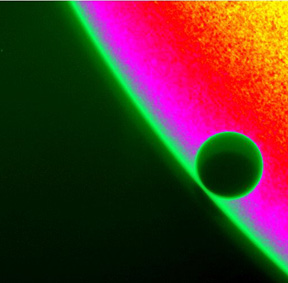
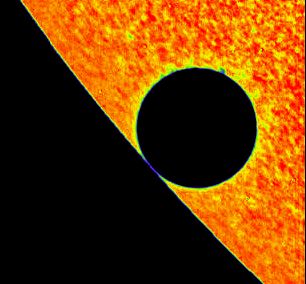
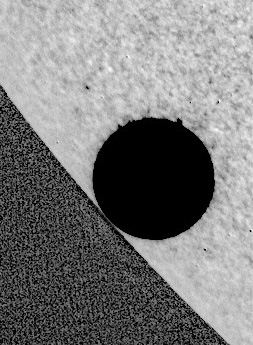
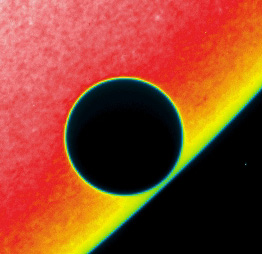
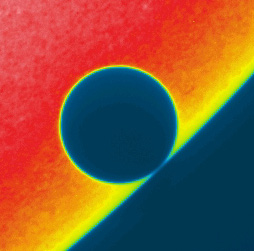
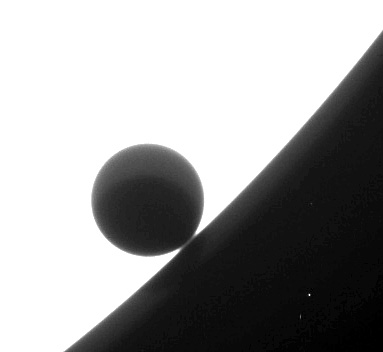
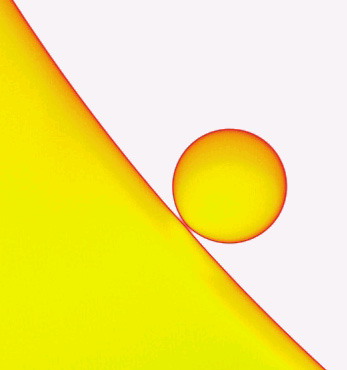
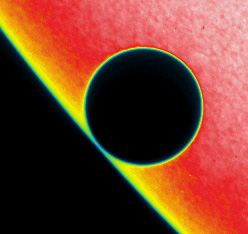
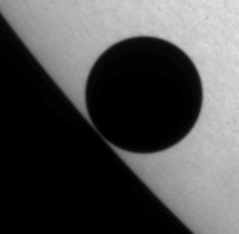
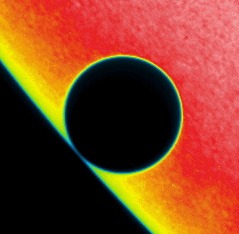
TRACE's WL pass band Image #6 - 05h 39 02 This picture show clearly the black-drop effect, with a Black and White palette. The darker band between Venus disk and the edge of the sun can be seen as well. Image #6B - 05h 39 02 The use of the thermal palette allows to highlight the black drop even more. Image #6C - 05h 39 02 This image in contour plot permits to see the depression of the sun disk edge which seems to fall onto Venus disk.
|
|
" TRACE DATA CENTER " |
" TRACE DATA CENTER " |
|
This image coming from the TRACE DATA CENTER still does not show any significant sign of the black drop. |
|
|
|
|
" TRACE DATA CENTER " |
" TRACE DATA CENTER " |
|
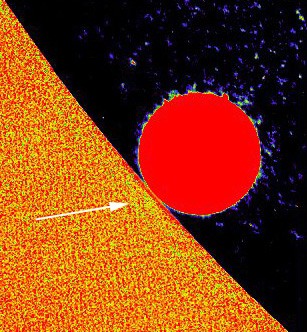
Some faint signs of the black drop are now visible on image #2. Note the apparent depression of the sun disk edge on image #2B at the tip of the leader. |
|
|
|
|
" TRACE DATA CENTER " |
" TRACE DATA CENTER " |
|
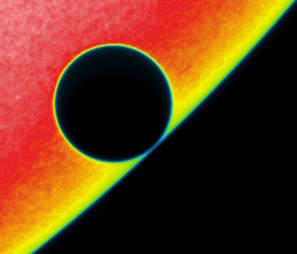
Image #3 : The effects induced by the black drop are getting
more important. |
|
|
|
|
Magnification of image #3 :
Note the leader tip pointing at the depression as a clear effect of the black drop. " TRACE DATA CENTER " |
|
|
|
|
" TRACE DATA CENTER " |
" TRACE DATA CENTER " |
|
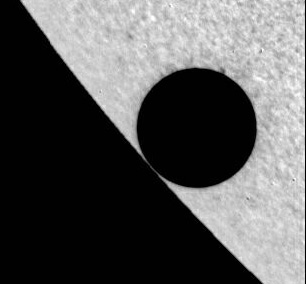
Image #4 The region covered by the black drop is larger and darker now Image #4B This image in isophote rendering displays the bridging cavity at the location where the black-drop effect is the most important. |
|
|
|
" TRACE DATA CENTER " |
|
Image #5 This image has been adjusted in a different manner in order to enhance the black drop effect. |
=======================================
" TRACE DATA CENTER
"
"
TRACE DATA CENTER "
|
Image #6 This picture shows quite well the black-drop, in a black and white palette. A dark band
between Venus disk and the edge of the Sun can be seen. |
|
" TRACE DATA CENTER " |
|
Image #6C - 05h 39 02 This image displayed in contour plot allows to visualize the depression of the Sun disk edge oriented towards Venus disk. |
|
|
|
" TRACE DATA CENTER " |
|
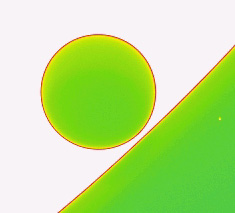
Image #7 - 05h 39 25 The black drop effect is still visible (green colour). |
To go
further : - Therefore, TRACE images
can be affected by some high contrast conditions during the transit: refer to Image
TRACE #1B at the beginning of this page
where dispersions affect the raw picture extracted from the TRACE Data center.
- In the website http://vestige.lmsal.com/TRACE/transits/venus_2004/ it is possible to find a picture taken by TRACE showing
the black-drop effect. The following legend is associated with this image : 2006-06-08 at 10:57:52UT - 11:01:24 UT, black drop effect.
Conclusion :
- The TRACE scientific satellite has not been designed to image high contrast picture such as the Venus transit
across the Sun disk.
- In addition to the previous point, the images are also affected by a contrast drop occurring from Venus and Sun
halos interferences. We would also mention that the limb darkening on
the Sun disk may play a role in the black-drop effect observation. Please consult section Part 8 of
this study where MTF and PSF are discussed.
There is a shared aspect between
TRACE images and the pictures CDADFS members are taken relatively to the black-drop effect :
- It may be important to consider the apparent curvature at the Sun edge (depression towards Venus) when the planet
disk close to the contact phase. This factor can be associated with the black-drop phenomenon, and hence to the
contrast drop. This depression effect can be observed on André Gendron s and Gilles Guignier s images (refer
to Part 4 "les
animations", and sections Part 7
and Part 7B of this study.
- We conclude this page by stating that there are certainly detectable effects of the black-drop phenomenon on
the satellite TRACE images, and that these effects are induced by the imaging instrument characteristics.
- The black-drop effect may not be considered as an intrinsic effect due to Venus and Sun disks, but rather a phenomenon
caused by instruments and seeing condition (optics collimation, MTF, PSF, thermal balance of the telescope, stability
of the atmosphere, limb darkening, ...).
References:
-
"TRACE DATA CENTER" http://vestige.lmsal.com/TRACE/Data/trace_cat.html
-
Glenn
Schneider, Steward Observatory, University of Arizona
gschneider@as.arizona.edu, http://nicmosis.as.arizona.edu:8000/ -------------------
In collaboration with Jay Pasachoff, Williams College
Jay.M.Pasachoff@williams.edu http://nicmosis.as.arizona.edu:8000/ECLIPSE_WEB/TRANSIT_04/TRACE/TOV_TRACE.html
- Le
transit de Vénus devant le Soleil Le matin du 8 juin 2004 Tel qu'observé de Dorval et de Montréal (Pointe-aux-Trembles) Québec Canada. Par des membres du CDADFS Transit de Vénus, retour à la première
partie
- Schneider, G., Pasachoff, J.
M., and Golub, L., 2004, "Space Observations of the 15 November 1999 Transit of Mercury and the Black Drop
Effect for the 2004 Transit of Venus," Icarus 168 (April), 249-256.
- Pises Atlas-PRISM98 from the Société Astronomique de Montpellier, C. Cavadore, B. Gaillard, P.
Martinole (astronomical image processing software).
GO TO Part 7
Transit of Venus, back to the first part
Or :
or
Authors: G. St-Onge, L. Morin and G. Guignier