
- Theoretical Elements
- SHG with a 115/900
- SHG with 90/1300 refractor (p.1
 )
) - SHG with 90/1300 refractor (p.2 )
- Newton 192/950
- Dobson 80/400 'Babydob'
- Ultra-simple solar spectrum
- Misc. electronic layouts
- Misc. optical layouts
- Untransversaliumisator software
- Processing videos software
- "PUSH TO" DIY system
- Radio control RA, Dec & focus
- Focuser 3D pour Vixen 150/750
- Year :
- Synoptic maps :
- Videos
- Maunder's Diagram
- Cycle 23 in images
- Venus Transit 2004
| Solar activity during cycle 23
| ||||||||||||||||||||||||||||||||||||||||||||||||||||||||||||||||
|
This assembly represents the Sun observed in the purple line of the ionized calcium (CaII-K) at the rate of an image a year since 1998 until 2007. Every image is in fact a superimposing of 2 observations made in approximately 2 weeks of interval, what allows to show the activity corresponding to a complete rotation. 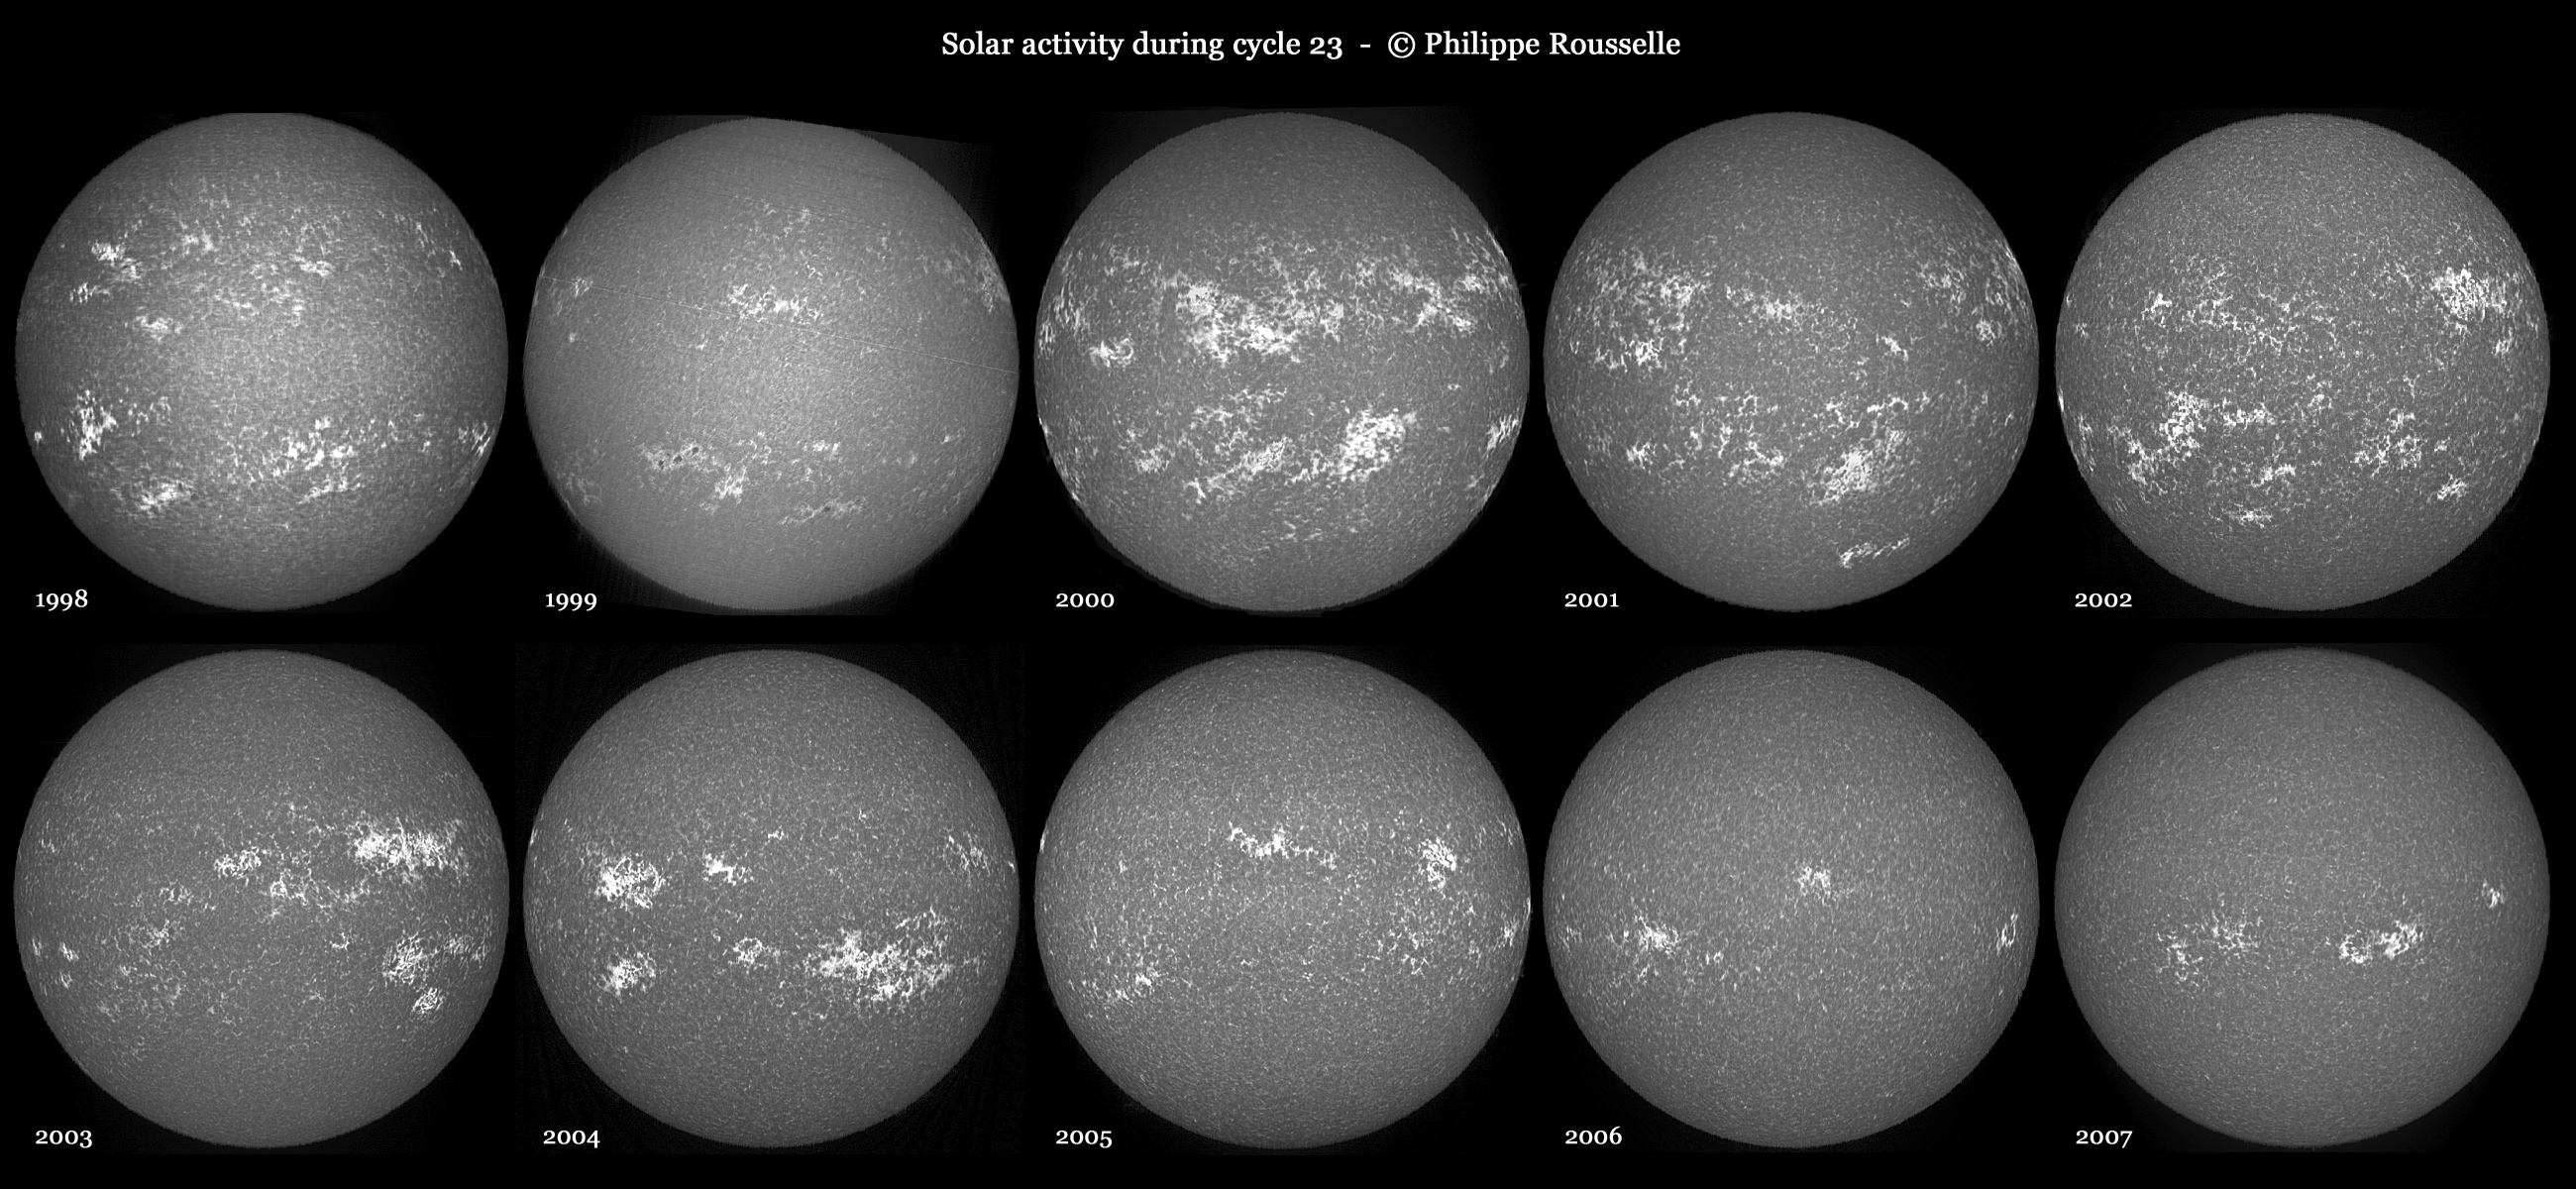 Heliographic North is at the top of the image and the West is at the right. We shall note the importance of facules from 2000 to 2002 (maximum of activity) and the migration of the active regions since the middle latitudes down to the equator (cf. Maunder's diagram). Click the image to see it in larger size. This second series is identical on the principle but obtained this time in the Hα line. The processing highlights more particularly the filaments whose distribution is much more ample in latitude than that of sunspots or faculae. Cette deuxième série est identique sur le principe mais obtenue cette fois dans la raie H-alpha. 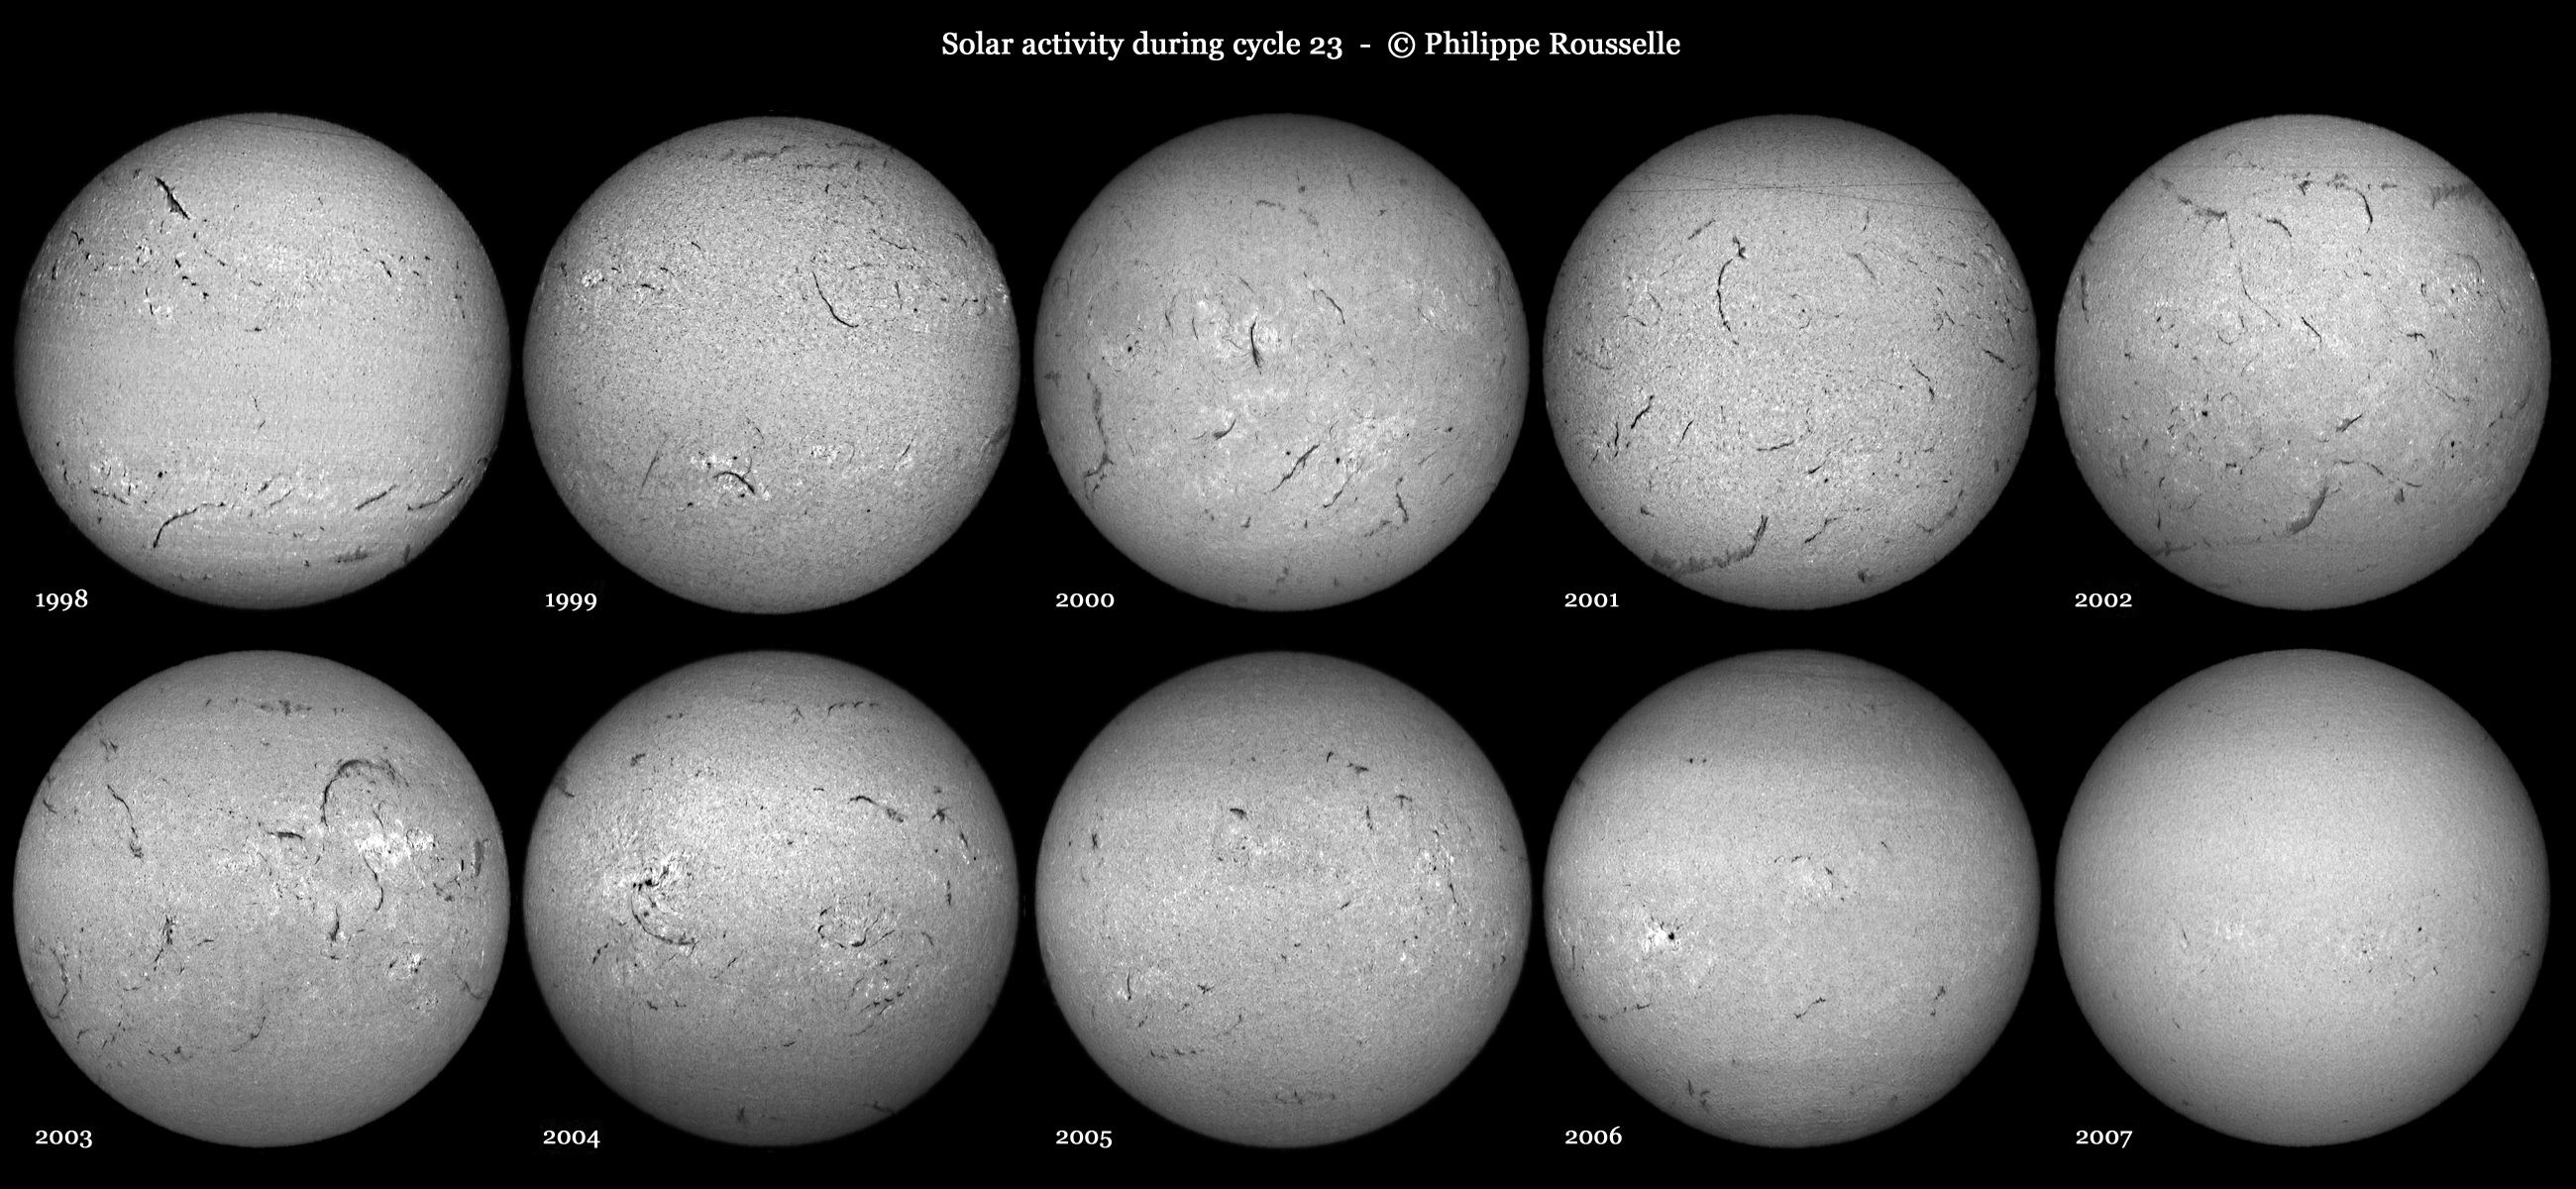 For all these images, the choice of July was expected because I can get generally enough observations in this period of the year. Here is the exact list of dates :
| ||||||||||||||||||||||||||||||||||||||||||||||||||||||||||||||||
 |