- Theoretical Elements
- SHG with a 115/900
- SHG with 90/1300 refractor (p.1
 )
) - SHG with 90/1300 refractor (p.2 )
- Newton 192/950
- Dobson 80/400 'Babydob'
- Ultra-simple solar spectrum
- Misc. electronic layouts
- Misc. optical layouts
- Untransversaliumisator software
- Processing videos software
- "PUSH TO" DIY system
- Radio control RA, Dec & focus
- Focuser 3D pour Vixen 150/750
- Year :
- Synoptic maps :
- Videos
- Maunder's Diagram
- Cycle 23 in images
- Venus Transit 2004
| Spectroheliography and video
|
|
Introduction Another possibility for the synthesis of the monochromatic images is to use a CCD array or a webcam and to record the spectrum as a movie during the drifting of the solar image. It is much simpler than to implement a linear CCD but the counterpart is a field smaller and some additional treatments. Principle of the method The sequence below is a video of the solar spectrum taken on September 26th, 2004, using a webcam. One sees the aspect of the H-alpha line around an active area. While the diurnal movement advances the image of the Sun on the entrance slit of the spectro, various chromospheric structures modify the H-alpha line. One can see clear or brilliant zones corresponding to "plages" and flares which are hotter areas. A sunspot appears as a dark horizontal line crossing all the spectrum. The end of the sequence shows a filament which shows a strong Doppler effect. A solar spectrum is a map of the luminous intensity according to 2 axis : wavelength and one space dimension (direction of the slit of the spectro, in theory geographical North-South axis). To achieve our goal and to reconstitute a monochromatic image of the Sun in 2D, it is necessary to regard the video thus recorded not as a sequence of images following one another in time but as a sequence of images following one another in the perpendicular direction to the entrance slit of the spectro. The movie thus constitutes a “cube” of images whose 3 axis are wavelengths and 2 orthogonal directions of solar surface. |

|
|
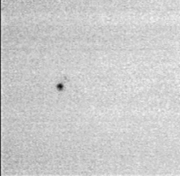
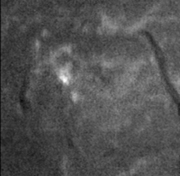
The wavelength being generally in X-coordinate, it is simple to extract with an appropriate software the column λ from all the images from the stack and to juxtapose them to obtain a monochromatic image. Here is, for example, an image in the continuum (left) and one in the center of Hα (right), both extracted from the video.
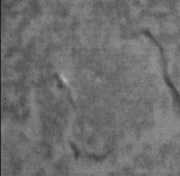
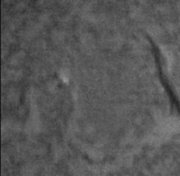
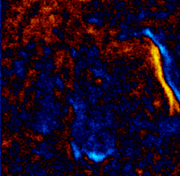
It is then easy, knowing dispersion in Å/pixel, to select monochromatic images to highlight the radial movements of plasma by measuring the Doppler effect. Below, the subtraction of 2 images in Hα-0.5Å and Hα+0.5Å gives the Doppler image coloured which shows important movements in the filaments. This technique will be also very usefull to go into the construction of magnetograms.
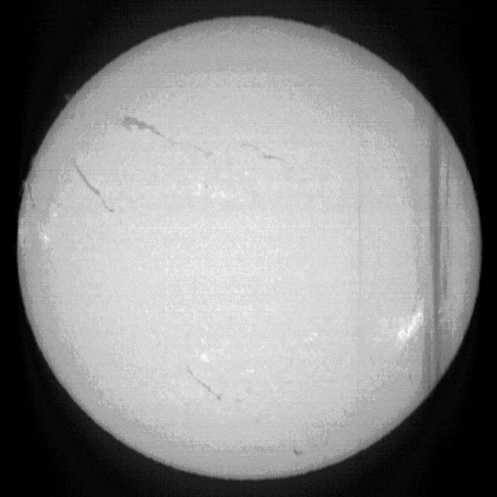
A DSLR having a video mode can also be used for this kind of imagery. Its broad sensor makes it possible to record the Sun in entirety. However, compression is very important and finally the image has a poor dynamics. Here is a Hα test done on July 28th, 2010 with a DSLR Canon 450D. The dark zones on the right are due to the passage of clouds.
The movie in the movie If, instead of extracting only one or two monochromatic images from the stack of spectra one extracts a large number of consecutive images and that one assembles them in animated GIF or AVI, one obtains a movie of a solar area with a wavelength variation. Other informations |
 |