- Theoretical Elements
- SHG with a 115/900
- SHG with 90/1300 refractor (p.1
 )
) - SHG with 90/1300 refractor (p.2 )
- Newton 192/950
- Dobson 80/400 'Babydob'
- Ultra-simple solar spectrum
- Misc. electronic layouts
- Misc. optical layouts
- Untransversaliumisator software
- Processing videos software
- "PUSH TO" DIY system
- Radio control RA, Dec & focus
- Focuser 3D pour Vixen 150/750
- Year :
- Synoptic maps :
- Videos
- Maunder's Diagram
- Cycle 23 in images
- Venus Transit 2004
| Magnetography
|
|
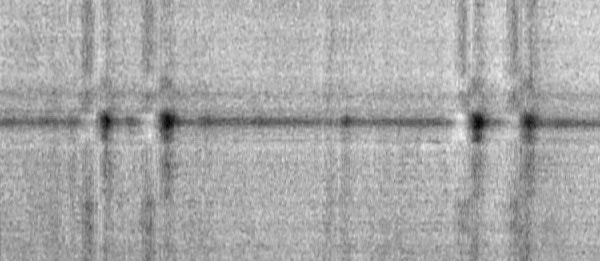
Introduction Under the action of intense magnetic fields, some spectral lines can show a perceptible splitting if the spectrograph has an important dispersion. It is the Zeeman effect, below illustrated:
These components are circularly polarized and in an opposite way. If the magnetic field goes outside photosphere, the blue component will be right circular polarized (clock wise, CW) and the red component will be polarized in the opposite direction (counter clock wise, CCW). Oppositely, if the magnetic field goes towards photosphere, the blue component is polarized CCW and the red one CW. Using a blade 1/4 wave retardation plate changes circular polarization into linear polarization. The 2 components are then polarized one vertically and the other horizontally. Then, a linear polarizer plate allows, by rotating 90° in a direction or the other, to eliminate 1st or 2nd component. The solution to fix the polarizer plate and rotate 1/4 wave plate is equivalent. Here is an animation of the phenomenon recorded on a sunspot:
and the difference between 2 images which constitute animation :
We note that the distance to the axis of the line is maximum in the umbra of the spot. In other words, magnetic fields is more intense in the umbra of the spot than in the penumbra. We can also notice weaker displacements in zones “out of spots” which can be plages for example.
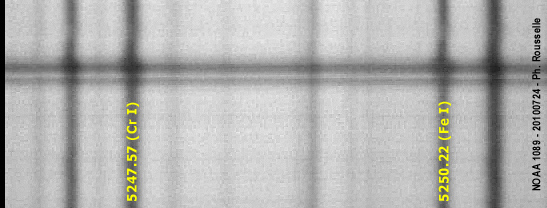
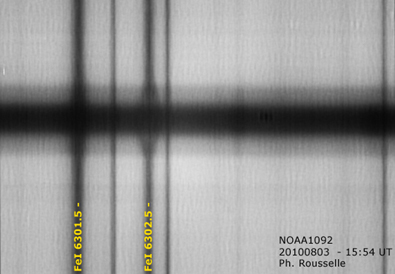
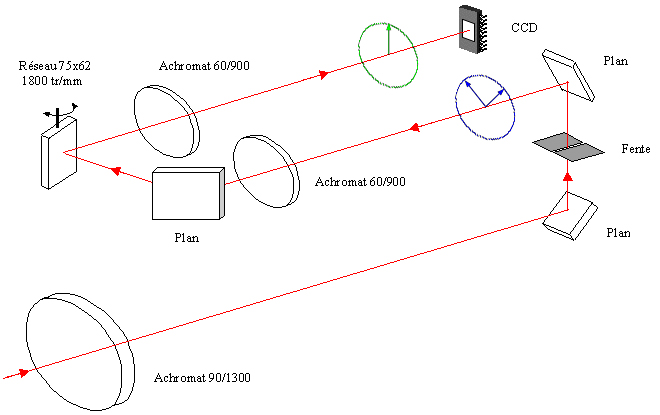
How to proceed ? The amplitude of the splitting is faint, even for the most magneto-sensitive lines. It is thus necessary to be able to record a very fine spectral bandwidth at very precise positions. My linear CCD consists of 14µm width photosites and its positioning in the spectrum is not sufficiently precise. The use of an array CCD seems more suitable to me for this application (see the spectrohéliographie et vidéo) page). A webcam with black and white sensor, with 5.6 µm pixels allows me a sampling about 0,025 Å/pixel (even 0.0085 Å/pixel with a 2880 gr/mm grating) and an easy determination of the wavelength of each array column. Only one disadvantage, the field of the camera will not make it possible to record the whole Sun. The optics of the spectroheliograph must be supplemented. 1 linear polarizer (in green in the simplified diagram below) is fixed right before the exit towards the webcam. The axis of polarization is made parallel with the axis of the entrance slit of the spectro. 2 1/4 wave plates (plastic film Edmund optics) are mounted near the entrance slit (in blue, with the 2 positions represented) in a support allowing their insertion - only one at the same time - in the optical path. The “rapid” axes of the plates are rotated 45° compared to the axis of the linear polarizer.
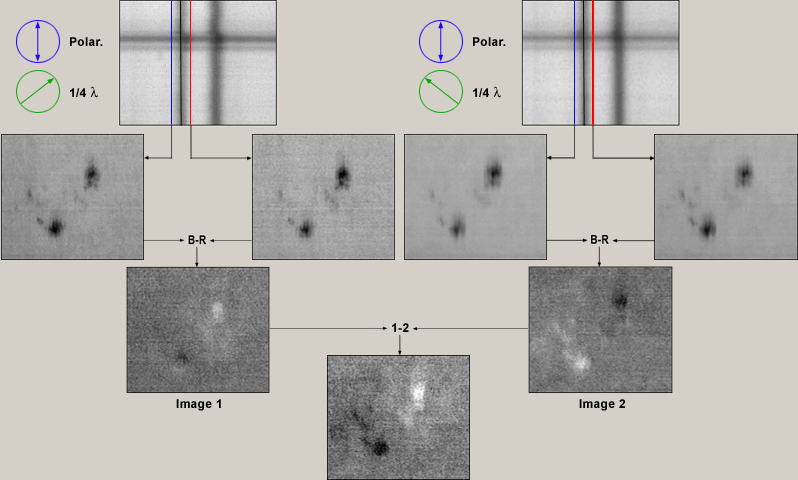
Once the interesting portion of the spectrum centered (5250.2 Å, 6302.5 Å, etc), one can launch video capture while placing a 1/4 wave plate in one of the two possible positions and by letting the solar disc drifting on the slit. In the same way one makes the second acquisition after having changed the 1/4 wave plate (or 90° rotation). The recorded videos will make it possible to extract the monochromatic images on both sides of the selected magneto-sensitive line.
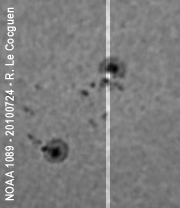
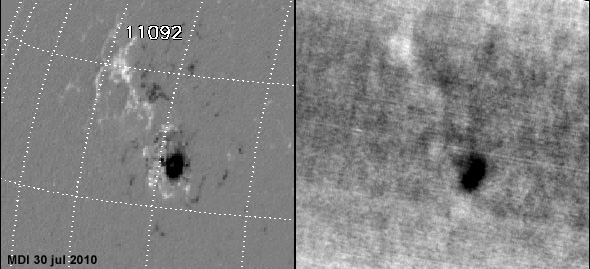
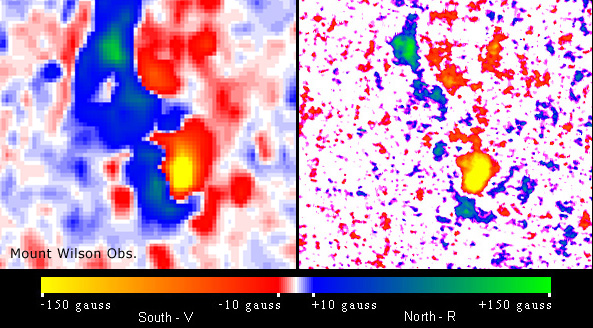
The Magnetic north polarity is coded in white and the South polarity in black. Various representations exist, as black and white of SoHo's magnetograms or the colour scale used by Mount Wilson Observatory. Here some final images of magnetograms.
The threshold of detection seems to range between 50 and 100 gauss in absolute value. At lower level, the noise caused by turbulence and the defects from all the chain of acquisition and treatment makes any quantification illusory.
|

|