The visible solar radiations such as it arises with the spectroscope mode of the instrument. We can observe the coloured continuum emitted by photosphere, from violet (390 nm) to deep red (670 nm). A multitude of more or less intense absorption lines coming from the chromosphere and the Earth's atmosphere are superimposed on this continuum.
This spectrum (obtained in the first order) is a justaposition of pieces of few tens of nm. Dispersion is 83 pixels/nm in the violet and 88 pixels/nm in the red (the scale is approximate ± 0,1 nm). Some strong lines are nammed.
Appearance of solar spectrum depends on
many parameters. It shows modifications between quiet photosphere,
active regions, sunspots, etc... The study of these variations
allows us to measure physical quantities controling matter at
the solar surface, as temperature, pressure, density, composition,
speed, magnetic fields...
|
Solar and telluric lines
Here is an example of spectrum modification
according to height of the Sun above horizon. The lower spectrum
was taken when the Sun was near the horizon and the upper spectrum
was taken when the Sun was higher in the sky. Many lines in the
lower spectrum are stronger than in the upper one. This shows
the strengthening of lines induced by Earth's atmosphere. When the Sun is near the horizon, its light must pass through a greater thickness of atmosphere. Thus absoption is also greater for telluric lines.


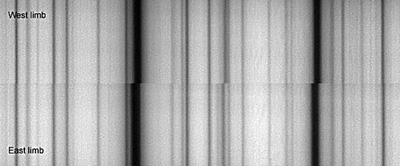
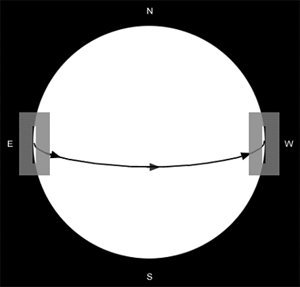
Another example of modification in solar
spectrum is shown below. The principle of this experiment is
based on the Doppler-Fizeau effect. The Sun being in rotation,
the gas at the Eastern limb moves towards us while the gas at
the Western limb moves away from us. By taking a spectrum at
the Western limb and another at the Eastern limb, one must be
able to observe a shifting of wavelengths if the dispersion of
the spectroscope is sufficient. No-shifted lines are induced
by Earth's atmosphere.
In rounded values, the sun rotates in 25
days at the equator, and a point of its equator courses 4.4 million
km during this time. Speed to be measured is thus about 2 km/s.
This speed must induce a Doppler shifting about 589*2/300000
= 0.0039 nm for the yellow line of Sodium. That thus represents
a variation of 0.0078 nm between the spectra East (shifted towards
blue) and West (shifted towards red). No-shifted lines are induced
by Earth's atmosphere.
The test that I carried out give values completely comparable and thus confirms the correct operation of my spectro.
|

 )
) )
)


