The idea according to which the spectroheliograph
allows to form images of the Sun in any wavelength of the visible
spectrum is completely correct, but all wavelengths do not present
necessarily any interest. There are even few wavelengths which show the
Sun under a different aspect from what we see in white light.
The continuum is emitted by the photosphere and thus gives images equivalent to the white light.
Most of absorption lines are produced very near the photosphere and thus reveal also almost nothing about the structure of the chromosphere. Some lines can however give invaluable information about magnetic fields or motions of matter at low level.
The lines formed in the chromosphere are the ones who are going to allow us to investigate this layer of plasma essentially modelled by magnetic fields. The most intense are hydrogen alpha (C) and ionized calcium (H and K).
The telluric lines indicate to us obviously anything particular and are even annoying for the observation of the solar spectrum.
We can say in first estimate (cf. reminders) that
the more we move the sensor closer to the centre of the line and
the more we observe high layers of the chromosphere. Conversely,
while going towards the extremity of the wings of a line, we join
the photospherical level. This is to modulate according to the
nature of the observed structures. Density, temperature, speed
of gas are not homogeneous in all points and there are intensifications,
clarifications or gaps in the spectral line.
It is also necessary to take into account the bandwidth of the spectroheliograph
which allows to isolate more or less correctly the heart of the spectral
lines. The contrast or/and the revealing
of the chromospheric
structures depend strongly of the bandwidth.
Some interesting wavelengths
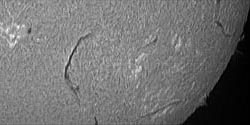
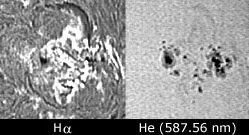
Hα line (656,28 nm)
Images obtained in this spectral line show the upper
chromosphere, where the density of the matter decreases and where
the magnetic pressure dominates the pressure of the gas. The plasma is "modelled" by
the lines of the magnetic field and reveals the structure. Spicules, prominences
and filaments, vortices, etc. are so many chromospheric structures
governed by magnetic fields. Near the core of the line (0,03 nm), the
image of the Sun presents many details, notably a granulation (4 - 5 ") which
structure changes near sunspots by taking the aspect of whirlwinds (Solar vortices).
Sunspots are still very visible. It is about the "middle layer" of chromosphere.
In the center of the line, we obtain the image of
the upper layer of hydrogen, characterized by brilliant areas and dark
filaments. Granulation and solar vortices are much less visible in this case.
Even the small sunspots seem erased.
At the sun limb, prominences are
quite visible but the narrow band-width can limit their visibility
if they have fast radial motions (important spectral shift). It is
with this wavelength that we can better observe the solar flares.
We also can, by masking the solar disc, highlight prominences and obtain an image looking like what a small coronagraph (prominence attachment) would give.
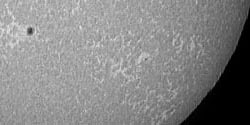
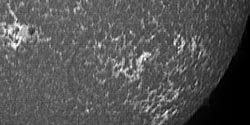
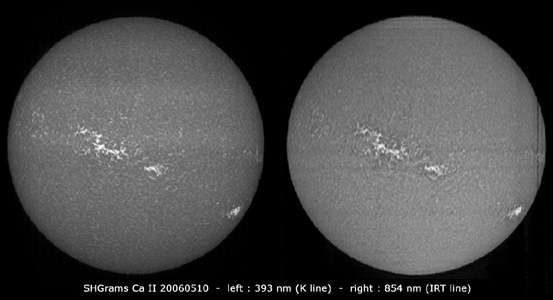
Ionised calcium K line (393.37nm)
This line is really very wide and complex, showing
a profile in absorption and in emission.
It results from various levels of the chromosphère. The emissive part
of this line reflects the temperature of the matter
and creates brilliant regions, called "plages" or faculae , which we notice
particularly around sunspots. We also observe spotless faculae, which
can be the place of appearing of new spots, or mark the
place of disappeared spots. Other brilliant points mark the outlines
of the cells of the supergranulation and form the chromospheric
network. The line H (396.85nm), also induced by ionized
calcium, gives the same images as her twin sister K.
�
As for the line of hydrogen, the deviation
from the axis gives the image of the low layer (500km),
close to the photosphere, with quite visible spots and faculae
areas which appear clearly. We speak here about the component
K1 of
the K line.
Near the core of the line (0,02 nm), the chromospheric
network appears clearly and facula areas brilliant (own emission)
with regard to the rest of the very dark disc. It is the component
known as K2.
The core of the line (component
K3) is characterized by a strong absorption
revealing dark filaments and, as in the case of the H alpha line,
prominences in emission at the sun limb. In fact, the images
obtained with a band-width of 0,05 nm can not give a pure image
K3.
We rather speak in this case about images K2,3. There is a less
good visibility of filaments and prominences.
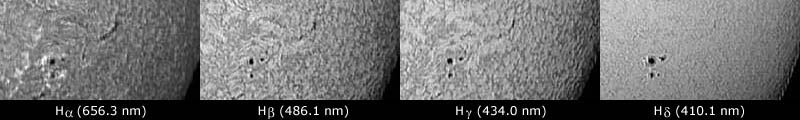
Hydrogen Hb, Hg and
Hd lines (resp. 486.13,
434.05 et 410.18nm )
Images obtained in these three lines also show
filaments and prominences but with a lower contrast. They also
reveal broad dark areas around the active areas and a dark chromospheric
network. The contrast of the details decreases much with H-delta
because the width of the line is rather narrow.
Helium "D3" line
(587.56nm)
This spectral line is at the
origin of the discovery of the element Helium the name of which
is diverted from Helios. It is
easily visible in emission in the prominences, appears on the
disc only in particular conditions. One can locate it in aborption
in the dense filaments and in the "plages". It can also appear in emission
in the flares when the temperature borders 20000 K and if the
density is sufficient.
IRT, ionized calcium infra-red triplet (854nm)
The CCD sensor allows generally to investigate
the spectrum a little farther in the red or the purple than
allows human eye. There are in the infrared 3 lines of absorption
induced by ionized calcium. Here, a comparison between
the purple and infrared lines shows that the same chromosphériques
structures are visible with a similar aspect.
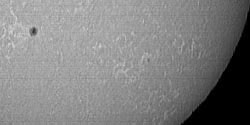
Images with other spectral lines
Some attempts were tempted with other
lines (iron 404,6 nm, magnesium 518,4 nm) which, although intense,
are however too much fine for the band-width of this spectroheliograph.
Images are close to what we can observe in white light, with
a clear reinforcement of facula areas. The image opposite is taken
with a line of iron (404,6 nm)
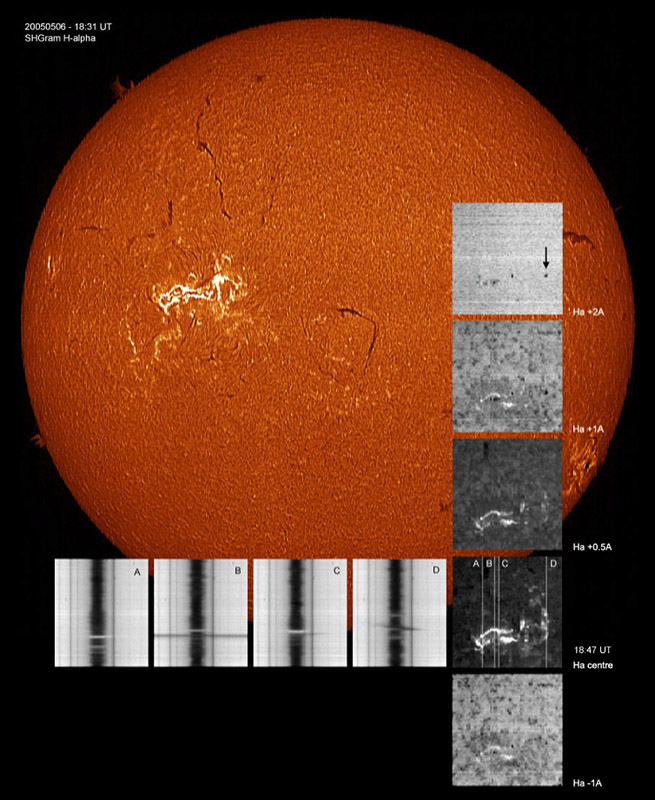
Examples of observable phenomenon with SHG
The playground of the spectroheliograph is vast. He
allows the observation of structure visible in white light (sunspots),
Hα (filaments,
prominences, flares, plages) and Ca-K (faculae, chromospheric
network) but also the observation of the physical phenomena which
are connected with it (motions of the matter,
magnetic fields, temperature...)
As example, the image below illustrates a part of what is accessible to the spectroheliograph. Taken in the center of Ha, it shows all the variety of the chromosphériques structures, in particular a very large flare. Images taken on both sides of the core of Hα (vertically) or spectres in diverse places of the active region (horizontally) allow to better understand the phenomenon.

 )
)