- Theoretical Elements
- SHG with a 115/900
- SHG with 90/1300 refractor (p.1
 )
) - SHG with 90/1300 refractor (p.2 )
- Newton 192/950
- Dobson 80/400 'Babydob'
- Ultra-simple solar spectrum
- Misc. electronic layouts
- Misc. optical layouts
- Untransversaliumisator software
- Processing videos software
- "PUSH TO" DIY system
- Radio control RA, Dec & focus
- Focuser 3D pour Vixen 150/750
- Year :
- Synoptic maps :
- Videos
- Maunder's Diagram
- Cycle 23 in images
- Venus Transit 2004
| Position of active regions NOAA 0649
et 0656
|
|
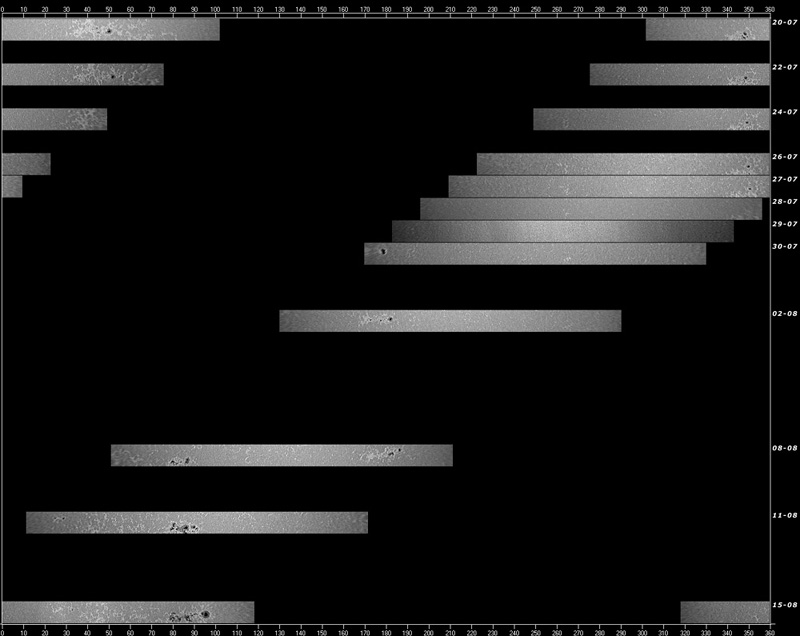
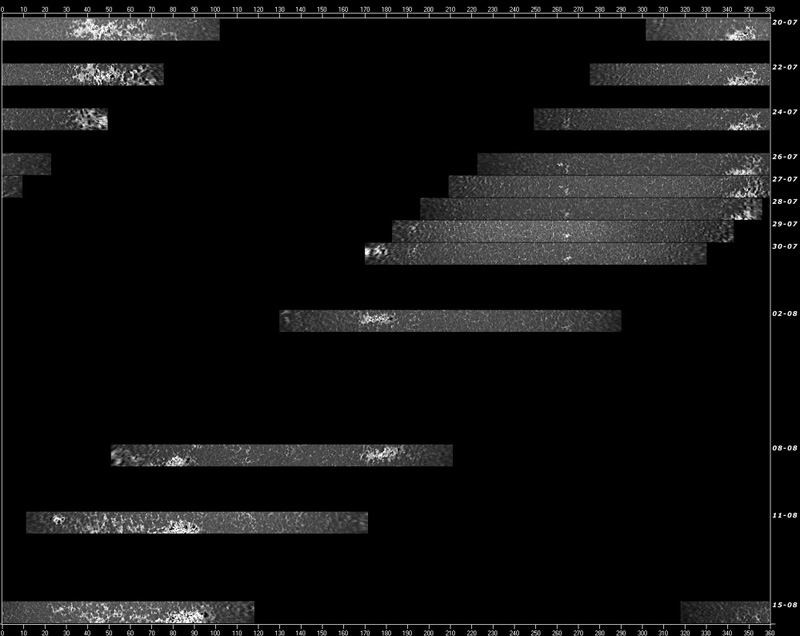
August 17th, 2004 I grouped together observations that I made between July 20th and august 15th (I have no previous images because of holidays). The conversion in planispheres allows to extract bands of same heliographic latitude and to make a diagram according to the longitude and time. The first diagram concerns the band from -5° to -15° in latitude. The images are taken in the continuum of the spectrum, and thus show the photosphere and the spots. NOAA 0649 was situated about 51° in longitude. A group of spots appeared near 85° in longitude in august. The NOAA which attributes a number to every active region appearing on the Sun effectively baptized it NOAA 0656. We can however ask if 0649 and 0656 are the same group of spots, as a lot of sites and forum announced it. It's not easy to know what takes place behind the Sun! However we can notice that 0649 seems to be reduced and that 0656, on the contrary, shows a longitudinal expansion very fast, indicating by extrapolation a "birth" near august 2nd near 80° in longitude. Even by prolonging the movement of the one or the other group, there is no connecting, there is a 10° minimum gap! The following diagram concerns the same zone for the same dates, but the images are taken in the K line of ionized Calcium. We see then the faculae which mark the active regions in all their spatial and temporal extension. One more time, facula area of 0656 seems to be independent. I thus think that NOAA 0649 and 0656 are 2 different groups of spots but I am interested by any information confirming or countering this assertion.
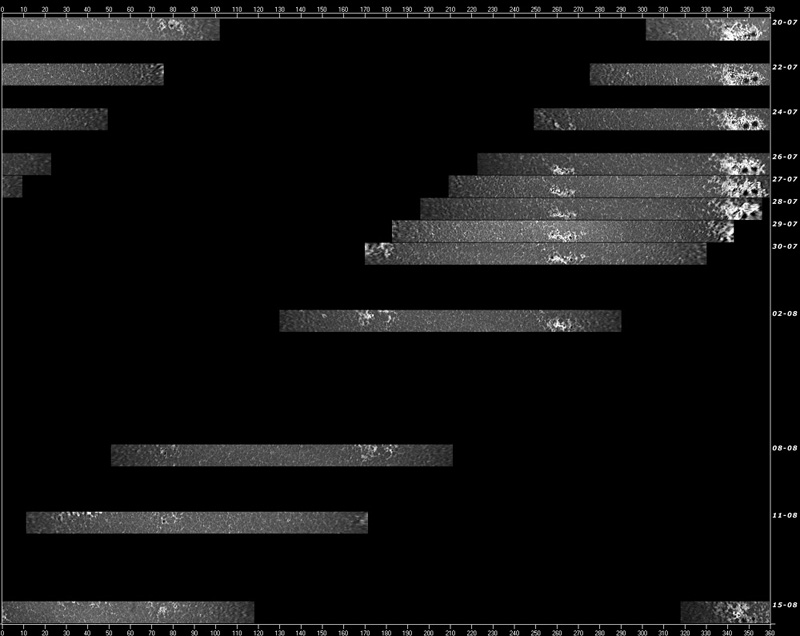
As comparison, here are 2 other diagrams of the same period but for the band from +5° to +15° in latitude where throned the group NOAA 0652, at 350° in longitude. The group appeared to the following rotation (here captured on august 15th) got the number 0661 but the position is identical and 2 enormous characteristic spots, now H class, thus stable, give no doubts about the identity of the group.
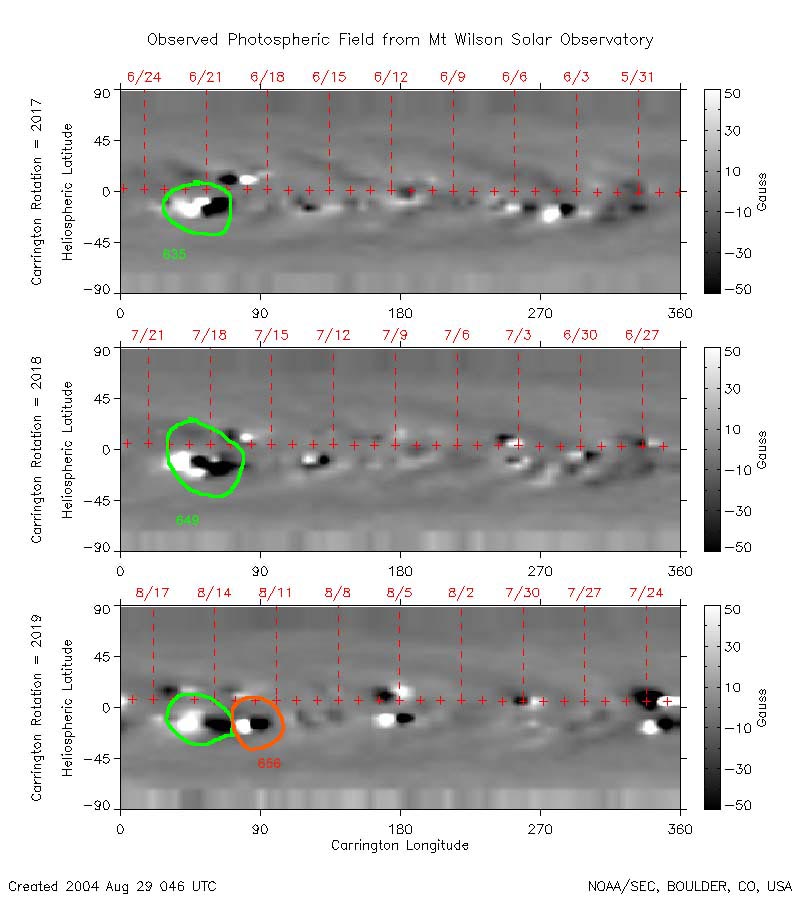
September 17th, 2004 Here are synoptic maps realized at the Mount Wilson Observatory. They show the magnetic fields during 3 rotations from 2017 to 2019. The white and black areas are opposite polarities and correspond to groups of spots and/or active regions.
We see clearly that a new area appeared at the right of NOAA 0649 (in green) to give 0656 (in orange). These two active regions thus have each their own identity. NOAA 0649 was the return of 0635. It is interessant to notice that the return of the active region NOAA 0649 is revealed by its magnetic field while spots disappeared. |
 |